We’d like to say a big festive ‘thank you’ to our amazing clients, that use Pump Checker®.

Pump Checker is used for monitoring and optimization of almost 4000 wells in the Permian and we have had some great experiences from working with the 721 users that have access to our cloud-based solution. The feedback and suggestions that we receive from our users, have helped us evolve and improve the functionality of our product over the years. It’s been a great journey so far and we are immensely grateful for the tremendous contribution that our clients make to our software evolvement.
Normally, in our blogs we like to write about something that is of use to our subscribers. This week we’re going to take a slightly different approach and write about a few ‘under the hood’ things we’ve been doing to make our software faster, more reliable and easier to use, as well as signpost what’s coming in 2022.
It’s our way of saying thank you to you….
Merry Christmas and best wishes for a happy and healthy 2022.
Software and Service Improvement
The current version of Pump Checker started life almost 10 years ago now, as three separate applications. Initially, just performing analysis of ESP performance and then evolving to include failure tracking and then realtime visualization. Each application developing along its own timeline organically, until we decided to merge the applications into a single entity. In our digital world, it made sense to amalgamate and enrich the product set, using common functions and data sets, as well as ensuring the richness of function is available to all users.
Back in April of this year we started a multi-threaded program of work to improve software and infrastructure to deliver the new vision and to eliminate some of the inefficiencies in the software to make life better for our clients. We've now been working on this for six months and thought it appropriate to provide an update on some of the things we've been doing and highlight the difference these changes have made.
Building the Team
The initial task was to continue what was started last year, investing in our in-house development capability and infrastructure expertise. That process is now largely complete, with our latest recruit (June Tee) joining this month. We now have a team of 10 full time professionals dedicated to our development effort.
We’ve been lucky to recruit great people, with the right mix of intellect, skill and expertise. Our people have come from a variety of industries, bringing with them fresh approaches and new ways of thinking, as well as enhanced rigor from the financial sector. We have invested in educating them in oil and specifically artificial lift, which has been interesting for them.
As mentioned, new people bring opportunities. One of those we’ve grasped is to leverage the expertise of the new people. During their training and education, they carried out reviews of every aspect of our operations and procedures, and spotted areas for improvement and since then we have taken steps to address these opportunities to streamline and improve our code.
What’s impressive is that the team expansion and development has been during covid, with everybody working from home. Until late November, a lot of the team had not met in person.
Improving Monitoring
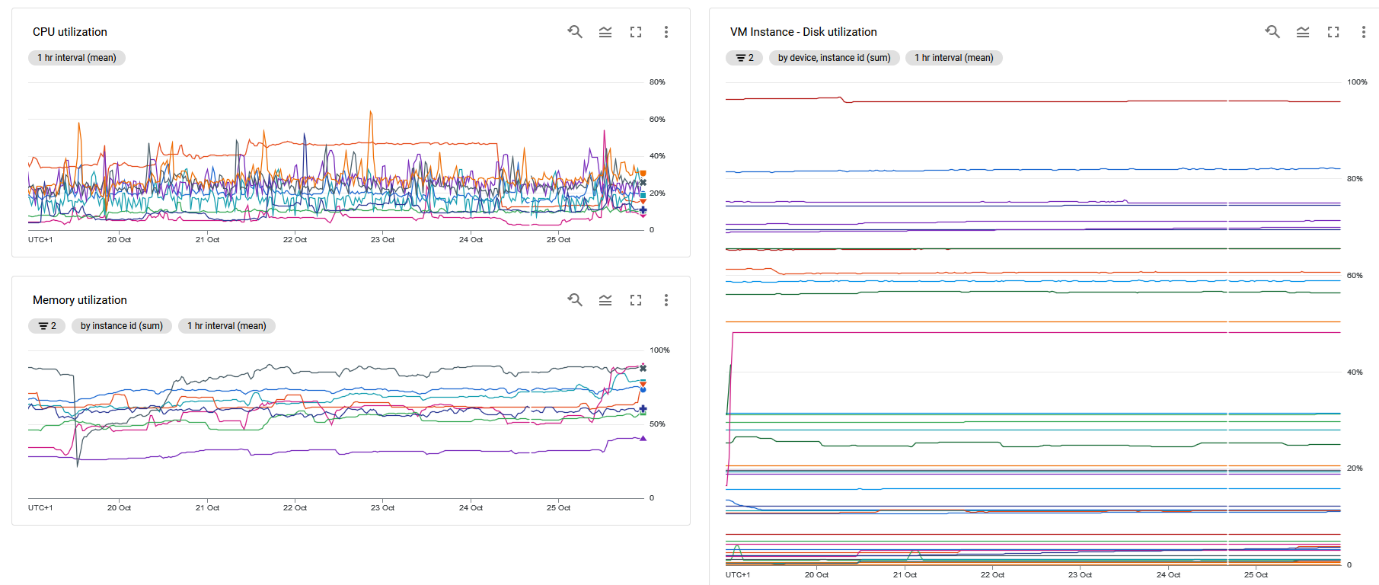
With more resource, we started to focus on understanding the key problems causing the most pain to our users. To make sure we were tackling things holistically, we invested in a new monitoring infrastructure, centralizing user activity and error logging from all client systems into a single repository. This gave us improved visibility on the issues being experienced by users and the errors being thrown by the system, allowing us to eliminate the gremlins (aka the bad robot).
Coupled to this, we introduced improved infrastructure monitoring, that enabled us to identify bottlenecks in system performance, with automated alerts to ensure that our support team are notified immediately of incidents at the hardware level.
Quick wins
Monitoring infrastructure more closely, allowed us to target changes to the configuration of servers and timing of things like backup processes, to make sure we’re maximizing resources available to end-users.
Additionally, software error monitoring allowed us to identify and implement small architectural changes to help free more resources, e.g. changing some of the background processes, such as test calculations or batch email production, making them more efficient to reduce impact on end users. There have also been major upgrades to the .NET software and 3rd party components that Pump Checker utilizes, to take advantage of bug fixes and performance improvements in these underlying aspects of the system.
We’ve also made strategic changes to functionality such as import processing and well test processing to improve data ingestion and our ability to quickly onboard clients. We’ve also worked to optimize the more data intense (slower) pages and make response time better. Improved processes and streamlined code have helped deliver resilience and performance. Such changes have taken time and effort to implement but have had a significant impact on the stability and uptime of the system.
That which is measured and reported improves exponentially
 We like to quote the English mathematician Karl Pearson, as we believe his quote accurately captures what Pump Checker does for our clients – measures performance and drives improvement.
We’ve also applied that in our software development processes. Changes over the last 6 months, mean that we have a measurably improved customer experience, as can be seen from the chart below, taken from the 3rd party monitoring tool we use to monitor uptime.
All of our cloud hosted clients have experienced this level of improvement in availability over the last six months.

Figure 1 - Server uptime reporting
Striving for excellence
We’ve always tried to be responsive to client needs and make changes quickly, that would improve the functionality of our software. That has been a blessing and a curse as ‘quick fixes’ and ‘hotfixes’ have introduced new bugs. Improved testing processes have helped eliminate some of these problems, but we’ve also striving to create a climate with a zero tolerance of errors and bugs. This is a key philosophy that’s instilled into the team. Even though bug free software is the ‘holy grail’ and something that does not exist anywhere, we are constantly striving to achieving zero errors and remedying any bugs as the highest priority, to keep our customers happy.
In this area we’ve made solid progress, resulting in error reporting being drastically reduced. In the last 3 months, we’ve also had the bandwidth to start investigating every incident of the “bad robot” that are seen by users where (both cloud and self-hosting) we can see this data. Work planned for the remainder of this year is targeting the elimination of all remaining legacy errors.
Infrastructure changes
Once we’d built up a few months worth of metrics on the infrastructure monitoring, we were able to start “right sizing” each of the client systems. The beauty of being cloud hosted is that changing out a server can be done in under 2 minutes in most cases, meaning that where we’ve needed to increase capacity, we’ve been able to do this without interrupting the service or plan any major outages.
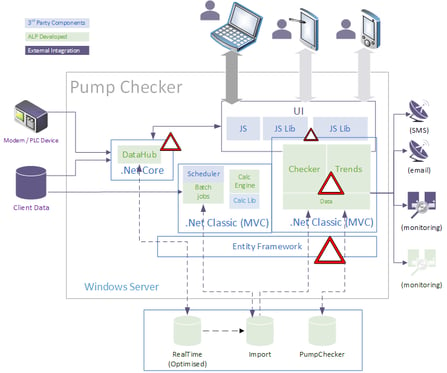
Figure 2 - Current architecture
Over the last few months, we’ve also been evaluating other cloud hosts, assessing their performance against our current, to determine if there is value in a strategic move to another. Yet, we’ve not found any performance advantage for our current architecture over our current host. However, as we move forward next year, other strategic factors, such as our preferred Machine Learning / Artificial Intelligence platform, may change the landscape.
Where we’re going in 2022
We do hope that you’ve noticed some of the progress that has been made. From a position six months ago, where users would experience the bad robot frequently or system outages, to now, where it’s only during delivery of software / infrastructure upgrades that we take the systems down for one or two minutes.
This is only the beginning. By the end of the year we’ll have dealt with our error backlog. As we move into the new year, as well as continuing to ensure that we deliver software with as few errors as possible, when errors do slip through testing into production, we’ll be in a position to react and eliminate them within the sprint cycle that we first see them.
From early 2022, we’ll be starting to deliver on a technology road map that will evolve what end-users see today into a much sleeker, device agnostic application, delivering the same high-quality data, but much faster, using modern web client technologies.
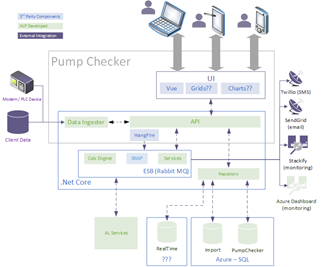
Figure 3 - Future architecture
In addition to a better/ faster interface, we hope to roll out what has been two years in the making - our predictive failure module.
The past two years has seen us assessing machine learning and artificial intelligence in a series of pilots, looking at how we can best use them to enhance our service offerings. These are now maturing, and we expect to be delivering services using AI/ML for such tasks as detecting production decline, prediction of pump failure and improved alarms / notifications, early next year.
Should anyone like more information on Pump Checker or the work we’re doing to improve it, please get in-touch.
.jpg?width=2097&height=770&name=ALP%20logo%20%26%20strapline%20-%20RGB%20(US%20version).jpg)
